Because the retail value chain has so many moving parts, advanced retail analytics has become a crucial component of decision-making for retailers of all sizes. In this blog, we’ll take a look at a framework that can assist retailers in making the most of data analytics to track crucial KPIs for the retail industry and create efficiencies throughout the value chain.
Zoho Analytics Framework for Retail
A proactive model that aids in the collection and analysis of retail value chain data is the Retail Analytics Framework. Upstream and downstream logistics are the two main value chain focus areas identified by the framework.
While downstream retail logistics concentrates on the sales and shipment side of things, upstream retail logistics mainly involves activities that help retail businesses get ready for sales, like acquiring goods and managing inventory. Ultimately, retailers can increase their revenue by enhancing upstream and downstream operations, which has an effect on the third focus area of the framework—finance.
Retail logistics upstream
Inventory control is a key component of upstream retail logistics because it is the foundation of the retail industry. Finding a balance between the quantity of inventory coming in and leaving is the fundamental objective of effective inventory management. Understocking could compromise availability while overstocking could negatively impact your cash on hand.
When it comes to inventory management, retailers frequently run into problems like a lack of confidence in the quantity of inventory to order and an inability to track losses and revenue drainers. However, with more sophisticated analytical tools, retailers can monitor critical inventory metrics to understand customer demand better and make more informed purchases and storage decisions.
The sell-through rate is a metric that can be extremely beneficial to retailers in this regard.
Rate of sell-through
The sell-through rate metric shows a comparison between the quantity of inventory shipped to a retail business by the manufacturer over time and the quantity of inventory sold by that business. It can assist retailers in learning more about the rate of product sales.
The sell-through rates of various products are displayed under one roof in the report on sell-through rates by product, which is provided above. Retailers can effectively track the sell-through rates of all their products using it as a single source of truth.
A product that sells slowly and may be at risk of being overstocked is said to have a low sell-through rate, whereas one that sells quickly and may be at risk of being understocked is said to have a high sell-through rate.
Watch our webinar on retail analytics to learn more about sophisticated analytical techniques that aid in closely monitoring key retail logistics KPIs.
Downstream logistics for retail
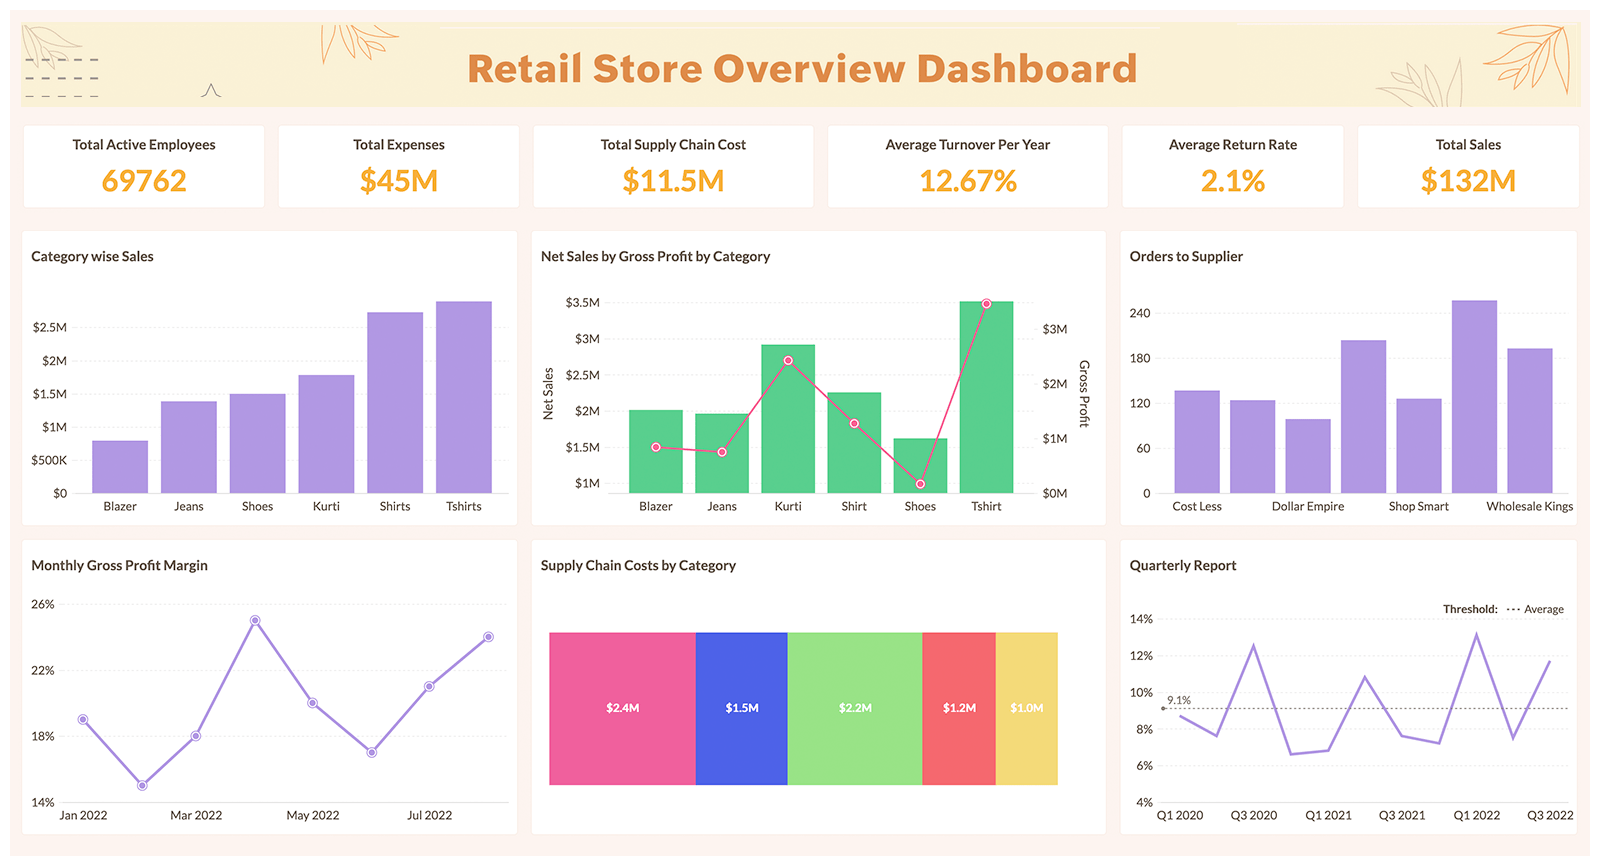
Retailers can interact with customers directly and gain a better understanding of their behavior through downstream retail logistics, which will help them increase customer engagement and increase sales. Retailers keep track of their sales from various angles, such as sales in terms of people, products, and transactions, in order to accomplish this. The total monthly sales are one of the first metrics that retailers look at when they begin to analyze their sales.
Monthly sales Trend
One of the most popular uses of this report is for retailers to use to uncover three key insights: any patterns in sales, customer purchasing patterns, and insights on sales targets to set for the future.
Retailers can forecast the monthly sales trend with the help of contemporary BI platforms, which is a bonus when setting goals. Retailers are able to validate their sales estimates and make more confident decisions about their sales targets thanks to the forecasted values.
Finance
The ultimate goal of streamlining your upstream and downstream processes is to help retailers become more profitable. Your cash flows can be optimized to produce better results and gain a competitive edge by analyzing crucial finance KPIs like gross and net profit.
Comparison of gross and net profits
While the net profit takes into account all the costs associated with other expenses businesses face, such as maintenance, salary, rent, and other costs, the gross profit is calculated by deducting the total selling price from the total cost of all the products. The Gross Profit vs. Net Profit report aids in comparing these two figures and offers details on the total amount of revenue still on hand.
In the past, retailers had to make this report by hand. But with contemporary BI platforms, we can humanize data interactions and speed up the process of learning new things. In Zoho Analytics, Ask Zia is the ML-powered AI assistant that enables even non-technical users to create reports and obtain insights by asking questions.
Summary
The Retail Analytics Framework offers a comprehensive strategy for successfully managing the retail value chain and optimizing performance in terms of upstream retail logistics, downstream retail logistics, and finance when powered by advanced analytics. To learn more about the Retail Analytics Framework and cutting-edge analytical capabilities, watch the entire webinar.
Sign up with PyramidBITS for Zoho Analytics today—and then sign up for a free personalized demo by one of our experts.
Also, Read
- Zoho CRM vs. Freshsales: 2 Feature-Rich & Powerful CRMs For Your Business.
- 9 Reasons Why You Should Switch To Zoho One
- How UCPA Found Success in Keeping Things Simple With 4 Zoho Apps
- What Advantages of Zoho Analytics compare to Microsoft Power BI in 6 Main Points?
- Clever Control – 9 Benefits of This Affordable & Easy-To-Use Employee Monitoring Software
- Meet Maqsam: The International Communication Solution
- Builder.io VS Elementor: 2 Web Design Tools Which is The Better for You?
- Builder.io – Build a Mobile App in 15 Minutes