Introduction
A sales dashboard should answer one question before your first coffee: are we going to hit the target, and if not, where is the problem? Most sales managers in Egypt cannot answer that until the last week of the month, when the Excel report finally arrives.
By then, the lead that waited two days for a call has bought elsewhere, and the deal that sat untouched for three weeks is gone. In Q4, with the annual target on the line, finding out late is the most expensive habit a sales team can have.
This guide covers what a useful dashboard looks like, the nine metrics worth putting on it, a sample layout in Zoho CRM, and how to read it in ten minutes a day.
What a Sales Dashboard Is, and What It Is Not
A sales dashboard is a single screen that shows the current state of your sales, updated automatically from the system your team works in. It is not a monthly report, and it is not a slide for the board.
The difference matters. A report explains what happened. A dashboard shows what is happening, early enough to do something about it.
For that reason, a good one is short. If a number on it would not change what you do this week, it belongs in a report instead.
The Month-End Report Problem
In many Egyptian companies, the routine looks like this. Each rep keeps their own sheet. On the 28th, the manager collects the sheets, merges them, and sends a summary upstairs. Meanwhile, daily progress is tracked through WhatsApp messages and “how is that deal going?” phone calls.
This approach has three costs:
- You see problems too late. A slow week in the first half of the month only becomes visible when it can no longer be recovered.
- The numbers are opinions. Each rep decides what counts as a “hot” deal, so the pipeline total reflects optimism more than fact.
- Your time goes into collecting, not coaching. Hours spent chasing updates are hours not spent helping a rep close.
Consequently, the manager ends up managing by memory. A dashboard built on live CRM data replaces that with facts, provided the data behind it is clean. Our post on CRM data quality explains how to get there.
The 9 Metrics Every Sales Dashboard Needs
Nine is enough. They fall into three rows, each answering a different question: what is happening today, where does the month stand, and will we hit the quarter?
Row 1: Today — Is the Team Working the Right Leads?
1. New leads by source. How many leads arrived today and this week, and from where: Meta ads, the website, referrals, exhibitions. A sudden drop from one source tells you to call marketing today, not at the monthly meeting.
2. Lead response time. How long a new lead waits before the first call. This is the number most managers never see and the one that costs the most, because a lead who waits is talking to someone else. If routing is the cause, see our guide to automated lead distribution.
3. Activities per rep. Calls made, meetings held and follow-ups overdue, shown per person. The point is not surveillance. It is spotting the rep who is overloaded and the one who has gone quiet.
Row 2: This Month — Is the Pipeline Healthy?
4. Pipeline value by stage. The total value of open deals at each stage, shown as a funnel. A funnel that is wide at the top and empty at the bottom predicts a weak month several weeks ahead. Structured stages make this reliable, as covered in our guide to sales pipeline management.
5. Stuck deals. Deals that have not moved stage or had any activity for a set number of days. This list is where most recoverable revenue hides.
6. Win rate. Deals won as a share of deals closed, by rep and by source. It shows whether a rep needs more leads or more coaching, which are two very different problems.
Row 3: This Quarter — Will We Hit the Target?
7. Revenue against target. Closed revenue this month and this quarter, measured against the target for each rep and the team. This is the headline number, and it belongs at the top.
8. Forecast against target. Closed revenue plus the weighted value of open deals expected to close in the period. If the forecast is below target with six weeks left, you still have time to act. Our post on sales forecasting with Zia goes deeper on prediction.
9. Average deal size and sales cycle. How big a typical deal is and how many days it takes to close. Together they tell you whether a deal opened today can still land before 31 December.
A Sample Sales Dashboard Layout in Zoho CRM
Zoho CRM builds each of these from the records your team already updates, using ready-made dashboard components. Here is how the nine metrics map onto them:
| Metric | Zoho CRM component | What you see |
|---|---|---|
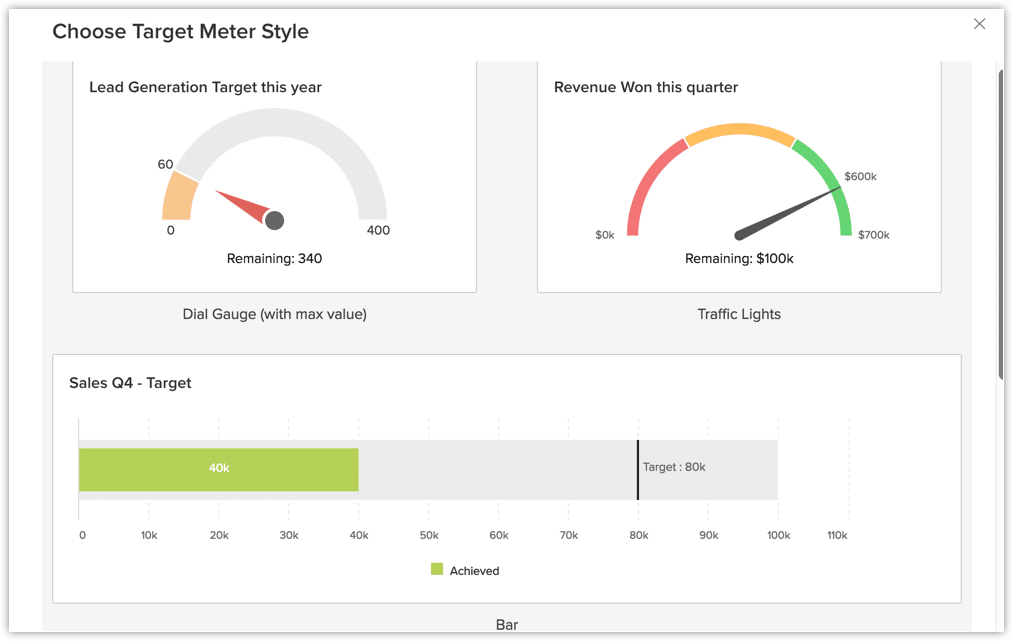
| Revenue against target | Target Meter | A dial or bar showing progress toward the target |
| Forecast against target | KPI | One figure with its change from the last period |
| New leads by source | Chart | Bars or a pie split by lead source |
| Lead response time | KPI | Average time to first contact |
| Activities per rep | KPI (rankings) | Reps ranked by calls, meetings and overdue tasks |
| Pipeline value by stage | Funnel | Value and drop-off at each stage |
| Stuck deals | Chart with a filter | Open deals with no activity in the chosen number of days |
| Win rate | Comparator | Reps or sources side by side |
| Deal size and sales cycle | KPI | Two figures with their trend |
Zoho’s own documentation describes each component in its analytics and dashboards guide, including how the Target Meter is set up.
Three features make the difference in daily use. First, every component drills down, so clicking the “stuck deals” bar opens the actual deals. Second, each role gets its own view: a rep sees their numbers, a manager sees the team, and the CEO sees the company. Third, Zia can flag unusual changes, such as a sudden drop in leads, so you are told about a problem instead of having to notice it. Zia sorts the signals; your team still does the selling.
How to Read a Sales Dashboard in 10 Minutes a Day
A dashboard only pays off if it changes what you do. This routine keeps it practical.
Every morning (5 minutes). Check row 1. Are leads arriving? Is anyone waiting too long for a first call? Does any rep have a pile of overdue follow-ups? Fix what you find before 10 a.m.
Every week (15 minutes, with the team). Open row 2 together. Go through the stuck deals one by one and agree the next step for each. This single meeting replaces most “any updates?” messages. It also gives you material for one-to-one coaching, which our post on sales coaching with Zia covers.
Every month (30 minutes). Review row 3. Compare forecast with target and decide what changes: more leads, a push on late-stage deals, or a different focus by source.
In Q4, shorten the cycle. Look at forecast against target weekly from now until the end of December, because every week you wait removes options.
4 Mistakes That Make a Sales Dashboard Useless
Too many numbers. Twenty-five charts on one screen means nobody reads any of them. Start with nine and add only when someone asks a question the dashboard cannot answer.
Vanity metrics. Total leads this year looks impressive and changes nothing. Prefer numbers that point to an action this week.
Building it on dirty data. If reps do not update deals, the dashboard shows fiction with nice colours. Make updating the CRM part of the job, and keep the required fields few.
Using it only to police. If the dashboard appears only when someone is in trouble, reps will learn to game it. Show it in every team meeting, celebrate the wins on it, and let reps see their own.
Sales Dashboard FAQs
What should a sales dashboard include?
Nine metrics cover most teams: new leads by source, lead response time, activities per rep, pipeline value by stage, stuck deals, win rate, revenue against target, forecast against target, and average deal size with sales cycle.
Can I build a sales dashboard in Excel?
You can, and many teams start there. The limit is that Excel shows what someone last typed in. A dashboard inside a CRM updates itself from the team’s daily work, so it is current without anyone compiling it.
How often should a sales manager check the dashboard?
Daily for activity and lead numbers, weekly for pipeline health, and monthly for results against target. In Q4, check the forecast weekly.
Does every salesperson need their own dashboard?
Yes, a simple one. A rep who can see their own target, pipeline and overdue follow-ups manages themselves better and needs fewer reminders.
Does Zoho CRM include dashboards, or is another tool needed?
Dashboards are part of Zoho CRM. Companies that want to combine sales data with finance or support data can add Zoho Analytics later.
See Your Numbers Before Month-End
A sales dashboard does not close deals. What it does is show you, in time, which deals and which reps need your attention. With nine metrics, three rows and ten minutes a day, Q4 stops being a surprise that arrives on 28 December.
Book a free Zoho CRM demo with PyramidBITS and see these nine metrics built on a pipeline like yours. You can also explore our CRM and AI solutions.